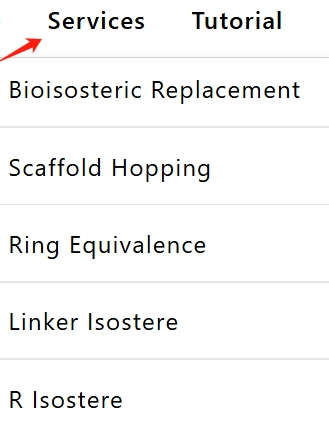
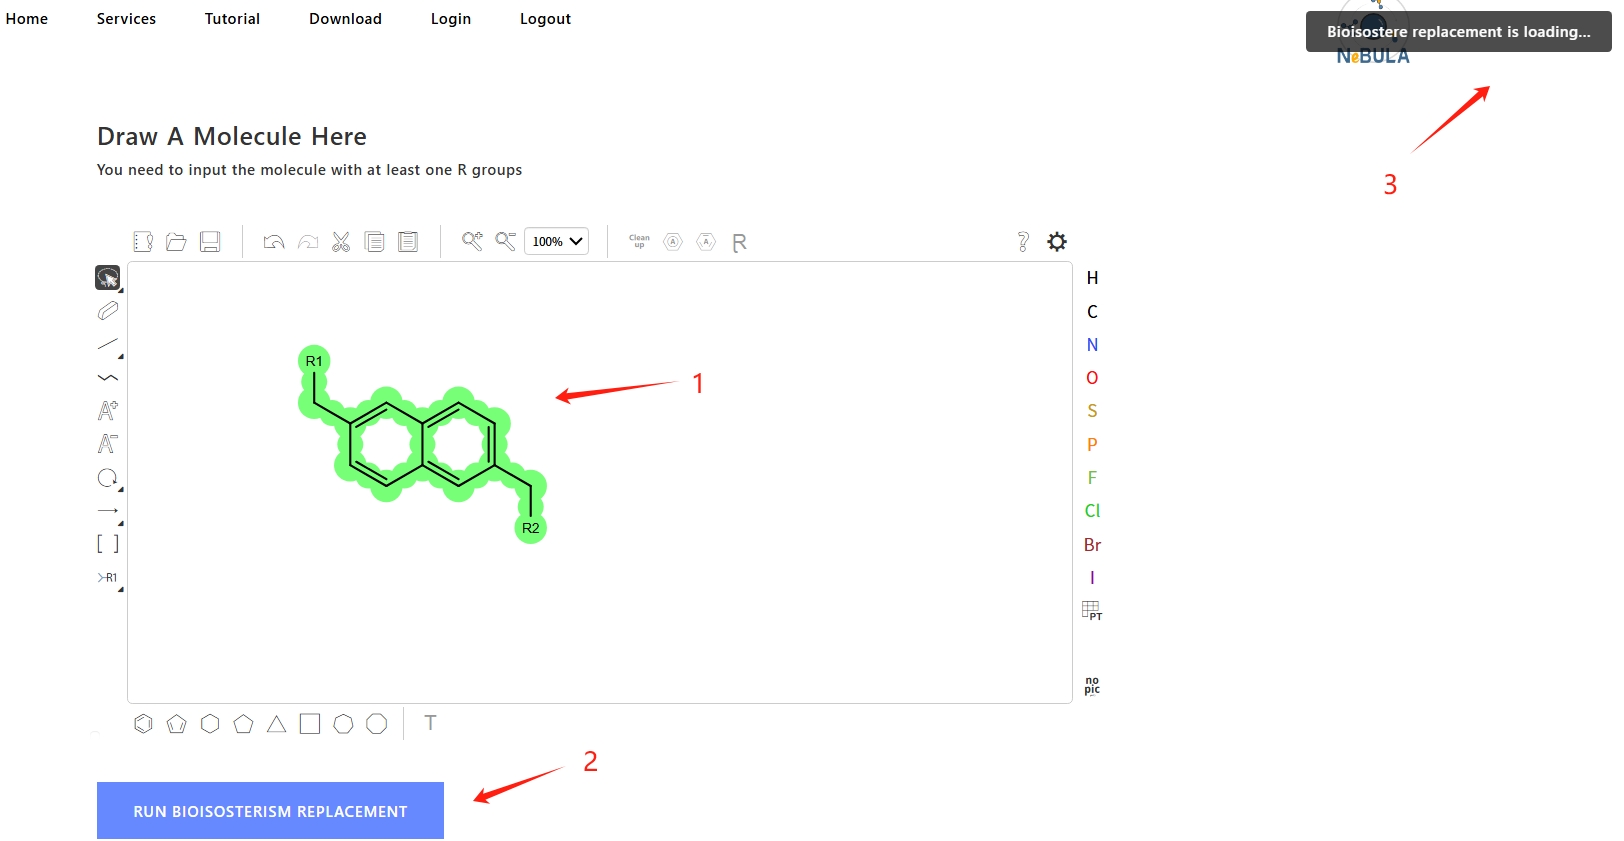
1. Select the type of molecular replacement you want to perform in the "Services" box.
2. Input (Draw) the SMILES of the reactant molecule in the "Reactant SMILES" box. Then click the "RUN BIOISOSTERISM REPLACEMENT" button to start the replacement calculation.
(Tips: The calculation time depends on the complexity of the reactant molecule and the number of replacement reactions. It will take about 1~3 minutes)
3. After the calculation is complete, the results will be displayed in the "Results" box.
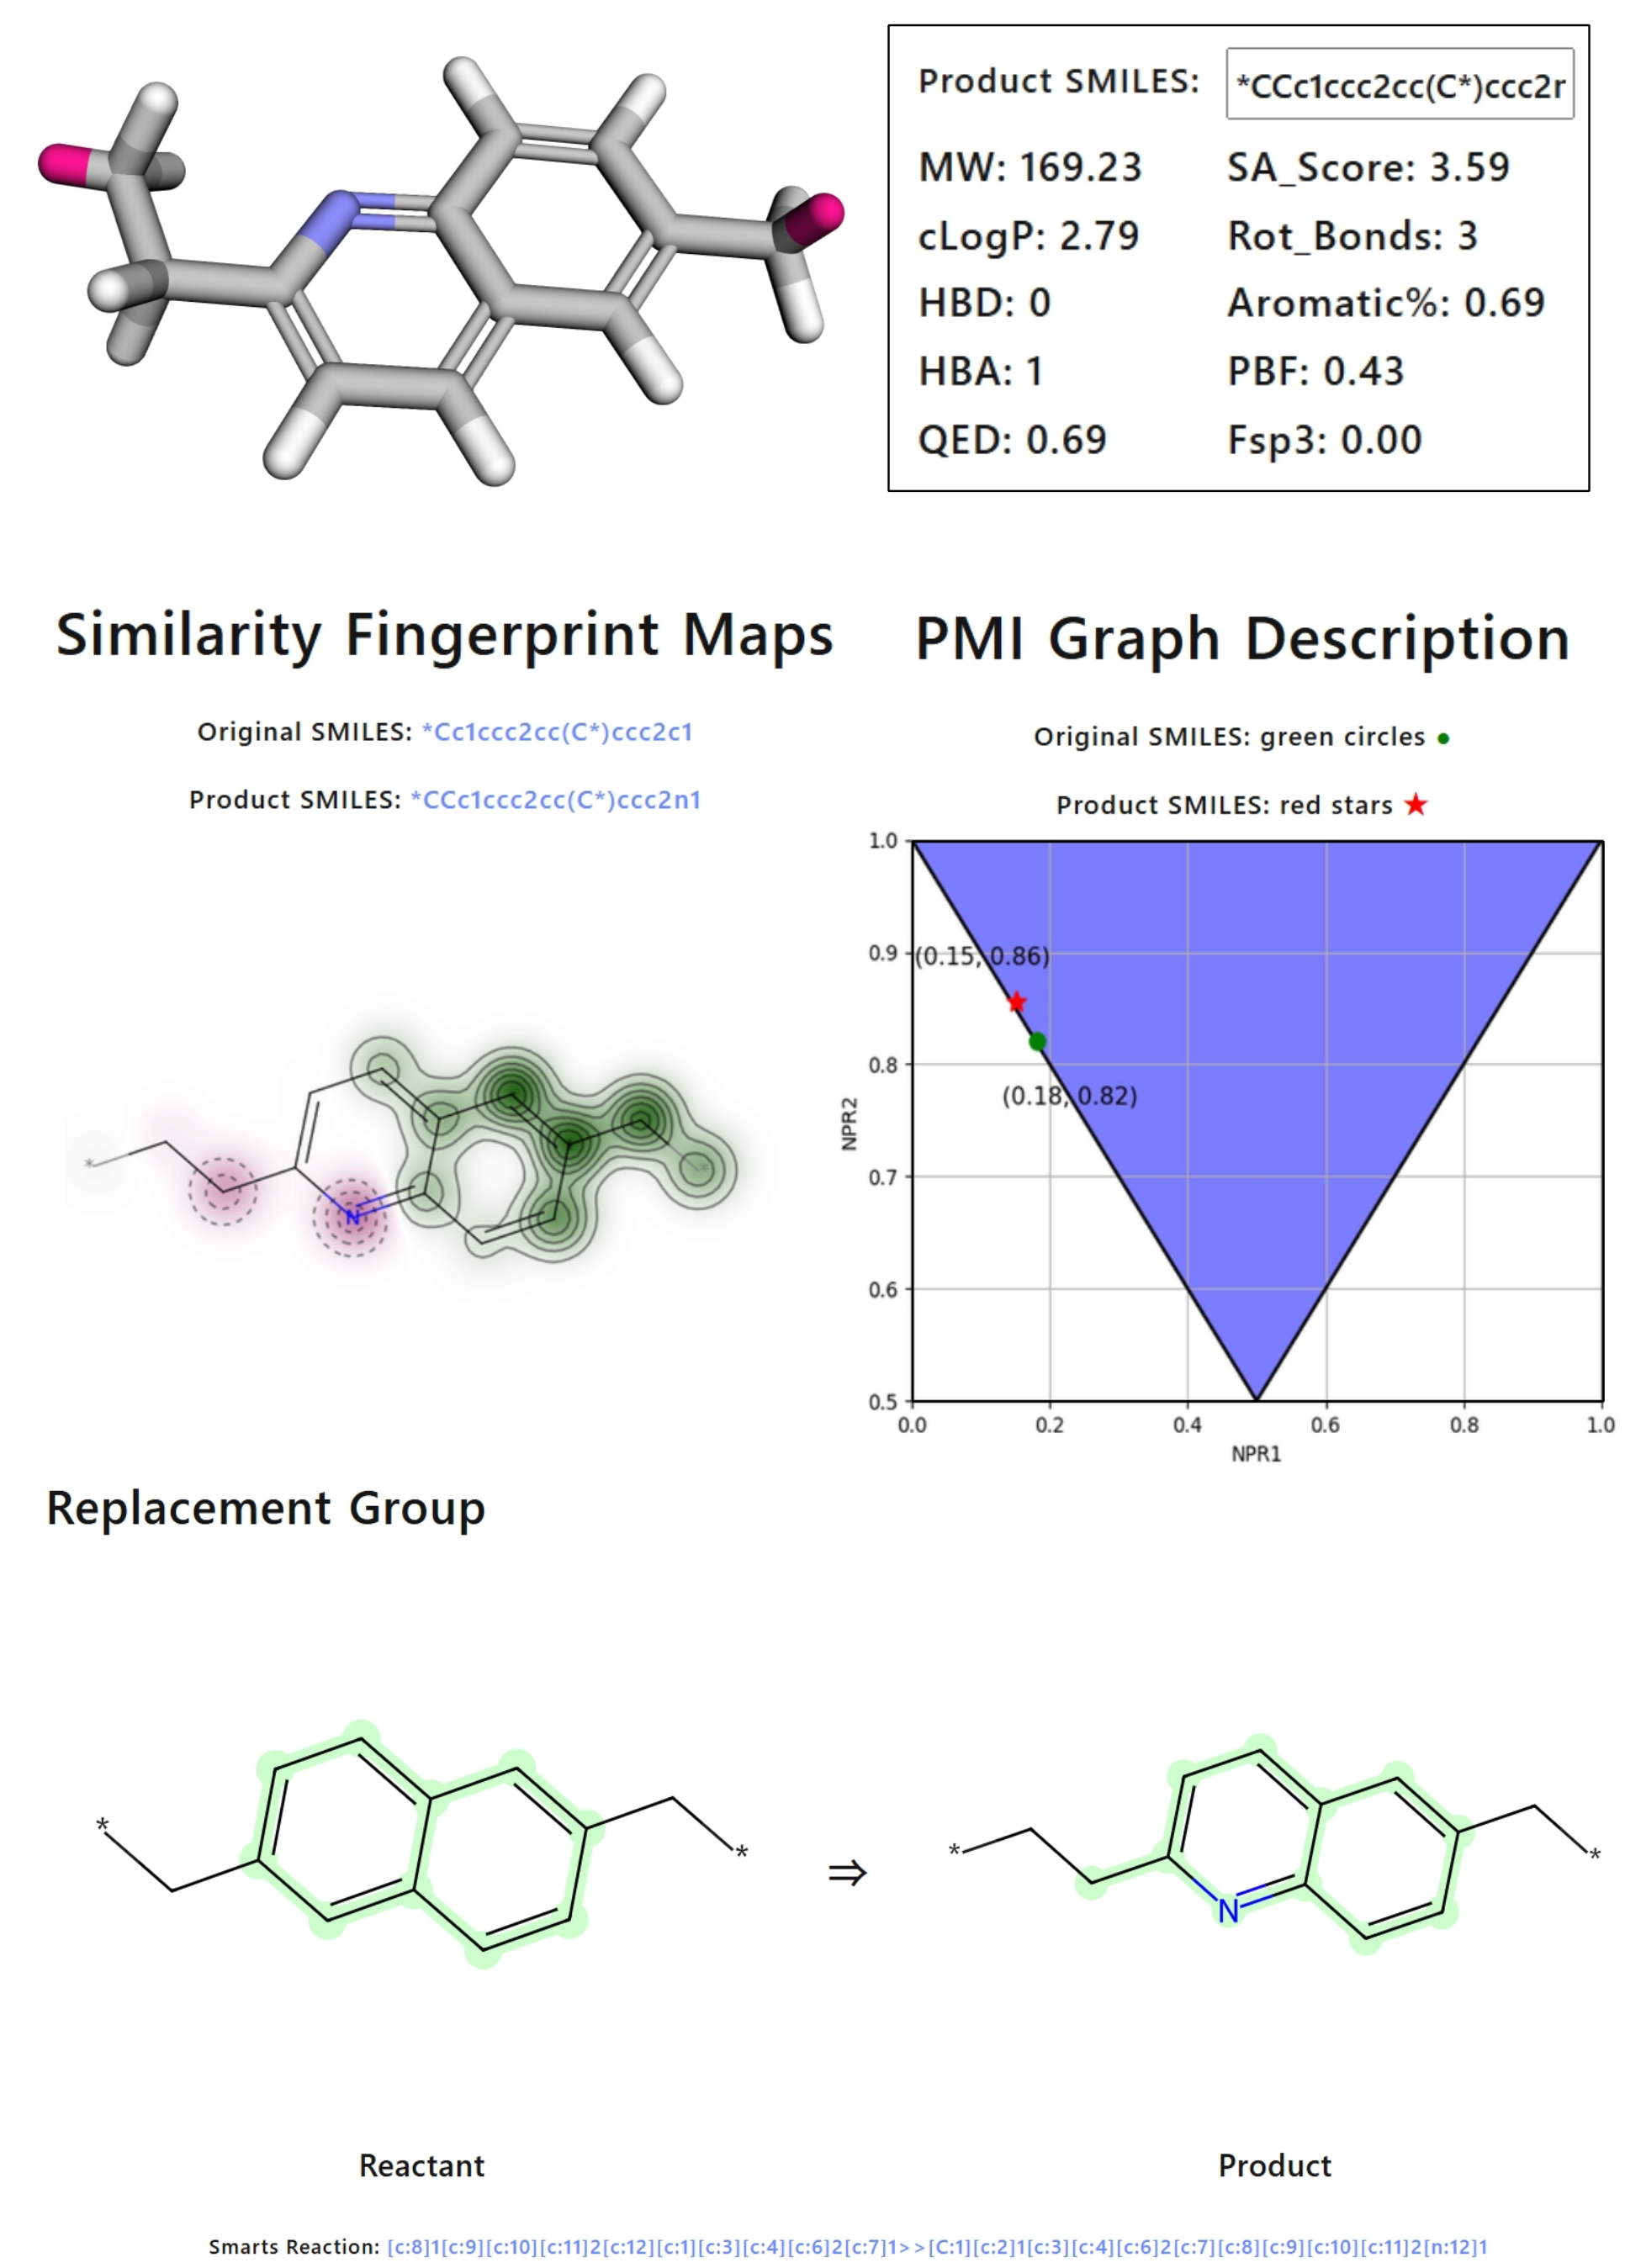
You can view the replacement reaction, product molecule SMILES, Radargram, 2d molecular image and chemical calculation descriptor information of each result.
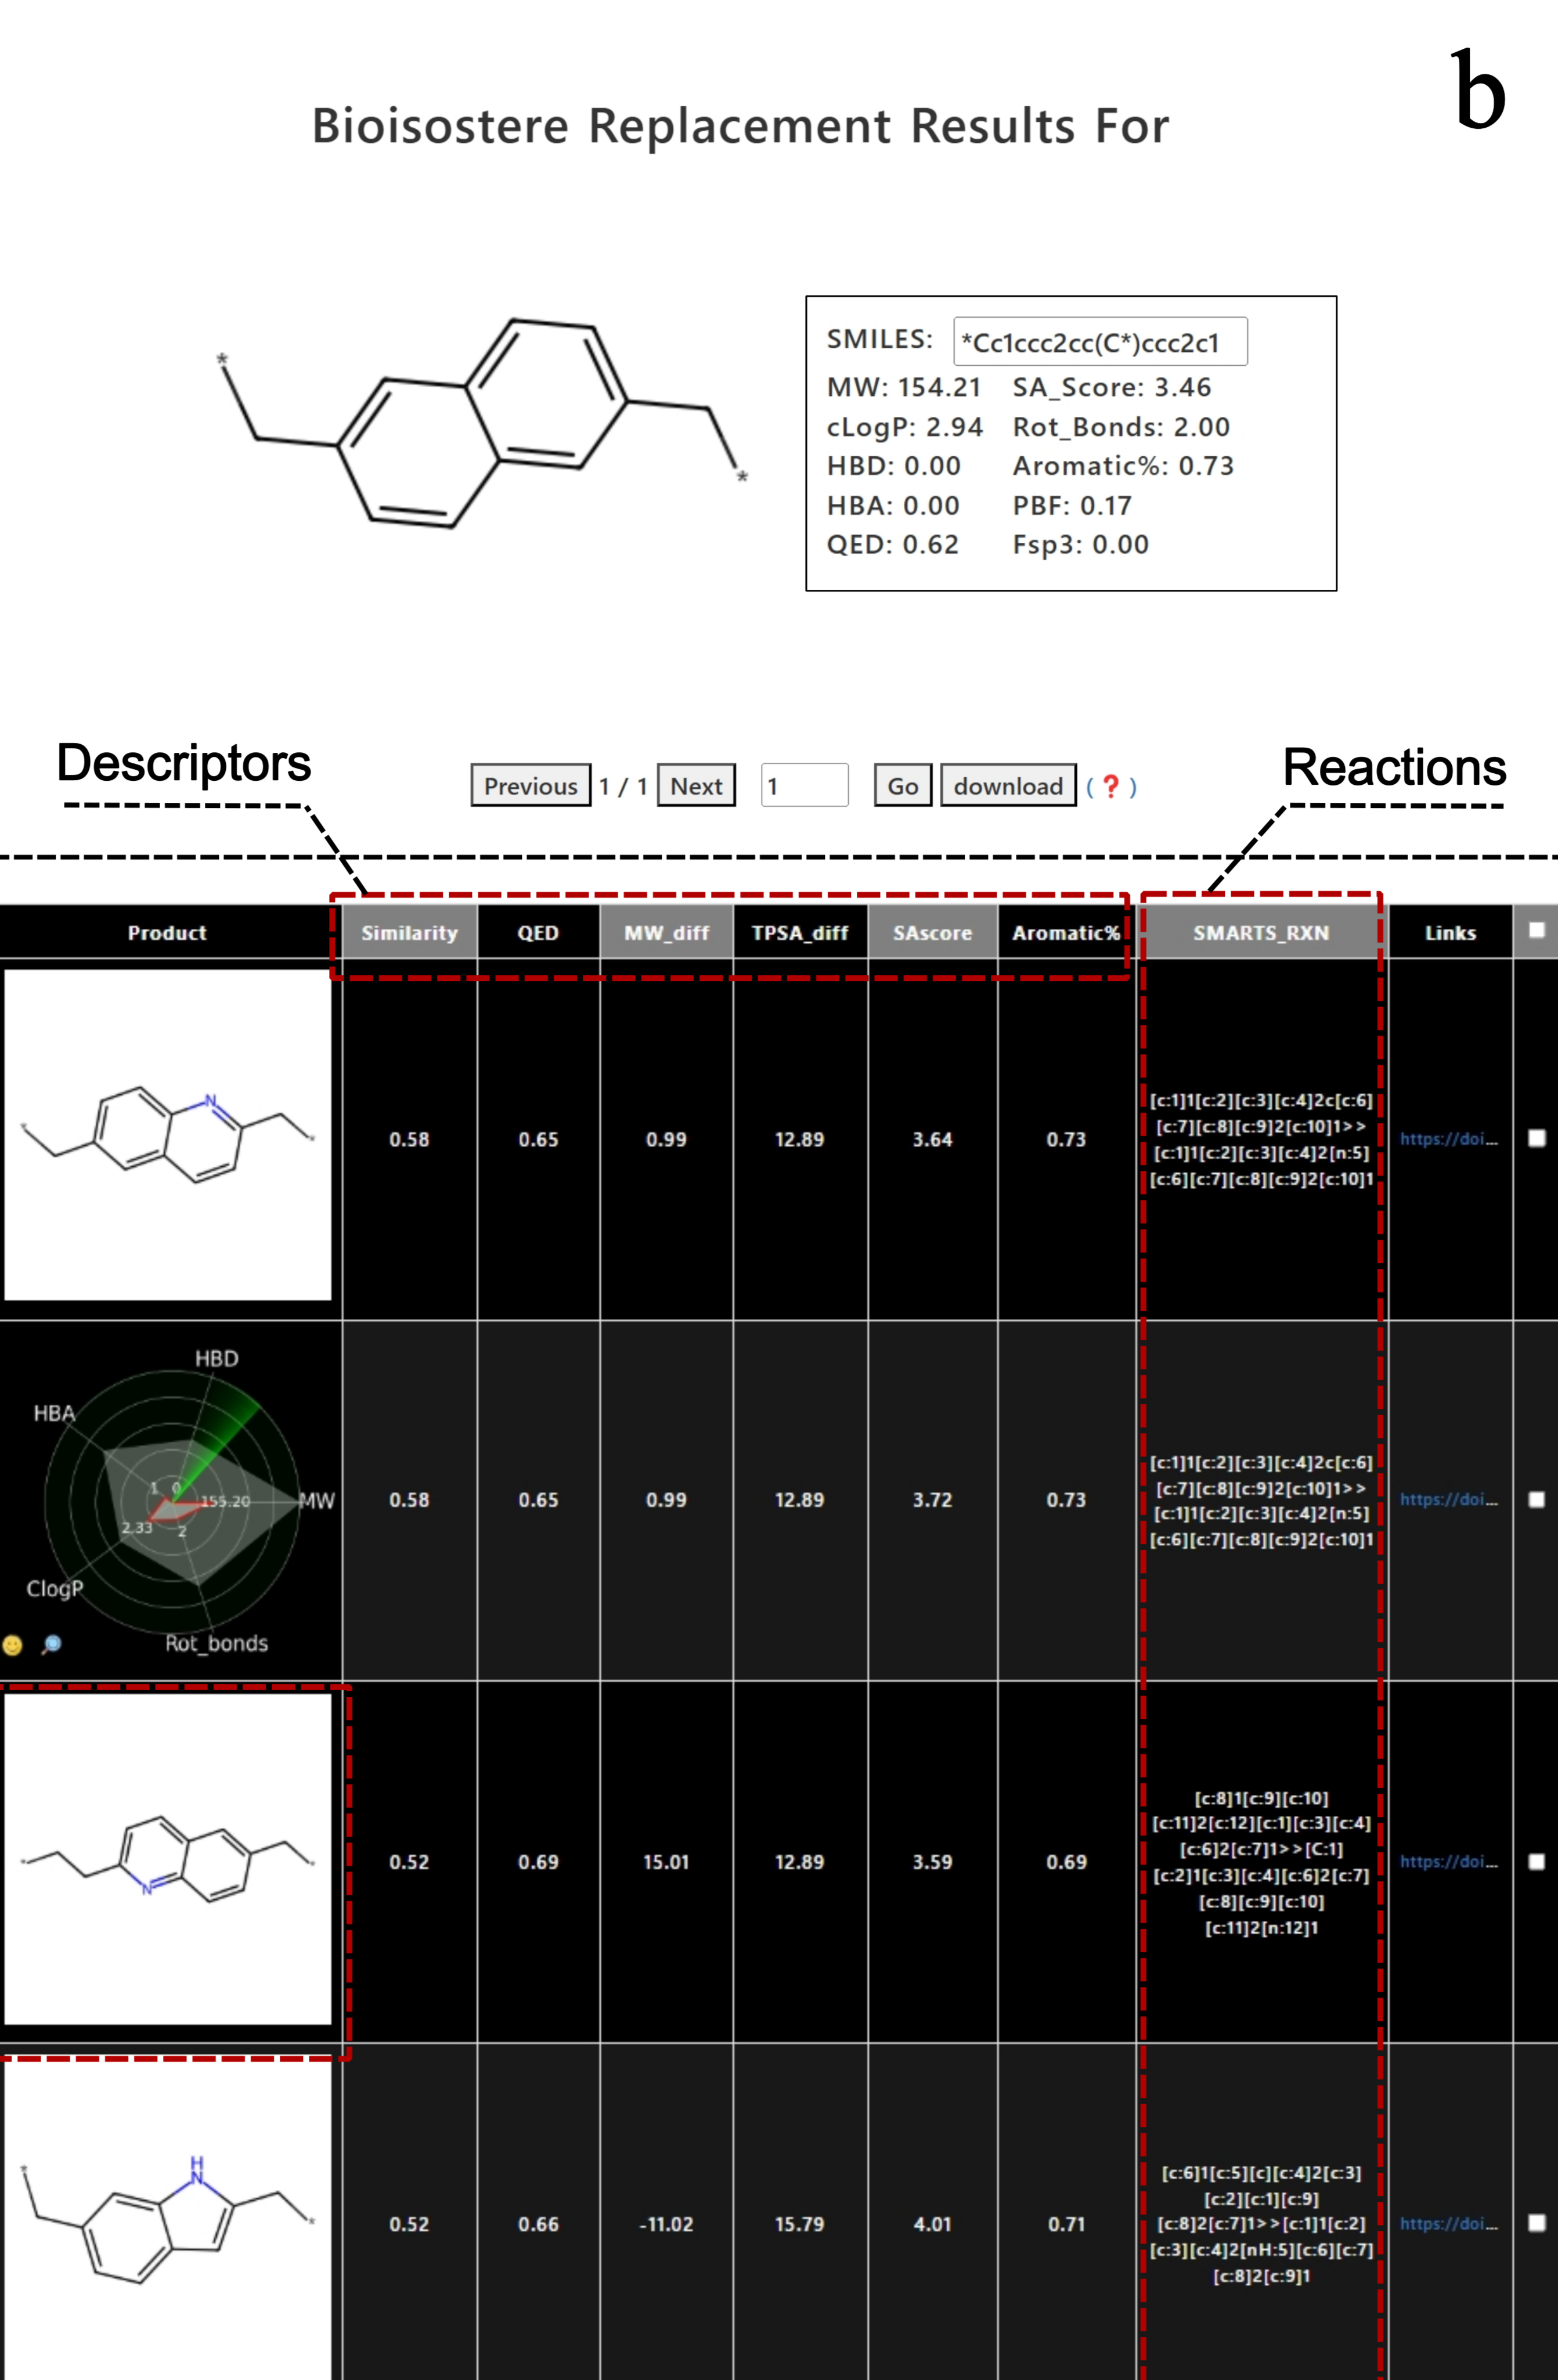
4. Click the "download" button to download the selected results in CSV format.
click the "Download All Products" button to download all the results in CSV format.
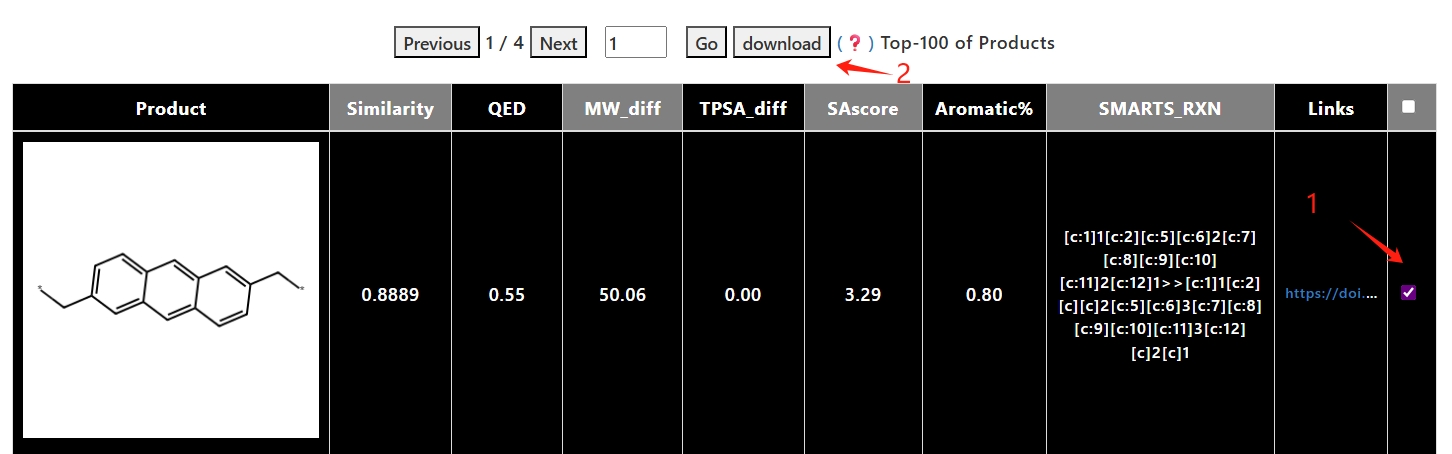
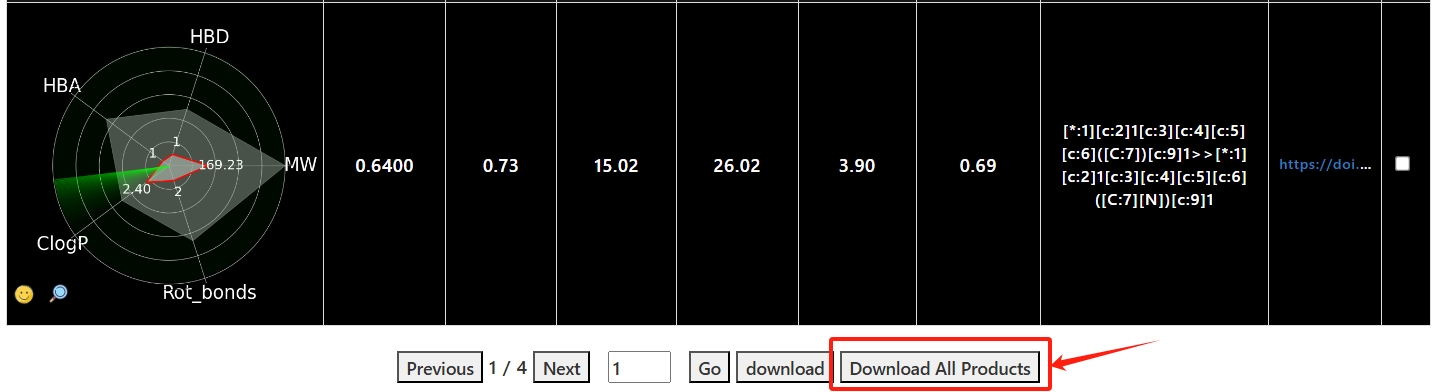
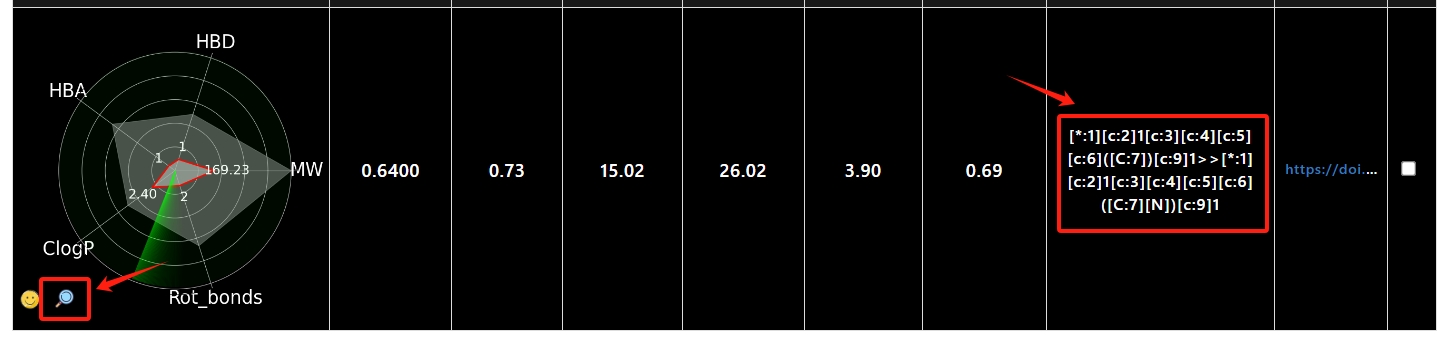
5. Click on the details button or the reactions to jump to the details page for each product molecule.
1.Similarity: Here we use the method of Tanimoto Similarity to calculate the similarity between the product and reactant molecules. <❓>
2.LogP(Octanol-water partition coefficient): Molecular hydrophobicity (lipophilicity), usually quantified as log P (the logarithm of 1-octanol/water partition coefficient),is an important molecular characteristic in drug discovery.
3.MW(Molecular weight): Molecular weight is the sum of the atomic weights of all the atoms in a molecule. It is expressed in atomic mass units (amu) or unified atomic mass units (u), which are equivalent to grams per mole (g/mol). In drug discovery, molecular weight is a critical parameter. According to Lipinski's Rule of Five, a molecule with a molecular weight less than 500 Da (daltons) is more likely to have good oral bioavailability. MW_diff: The difference in molecular weight between product molecule SMILES and reactant molecule SMILES.
4.HBA(Hydrogen bond acceptor): An atomic, ionic, or molecular component of a hydrogen bond that does not provide bridging (sharing) of hydrogen atoms.
5.HBD(Hydrogen bond donor): A bond or molecule that provides the hydrogen atoms in a hydrogen bond.
6.Rot_bond(Rotatable bond): These are single bonds (σ bonds) in a molecule that allow free rotation around the bond axis.
7.Fsp3(Fraction of sp3-hybridized carbon atoms): Fsp3 stands for the fraction of sp3-hybridized carbon atoms in a molecule.
8.SA_Score(Synthetic Accessibility Score):SA_Score is a metric used to estimate the ease of synthesis of drug-like molecules.
9.TPSA(Topological polar surface area):TPSA is a parameter used to describe the polar surface area of a molecule. It is a measure of the total surface area of polar atoms (such as oxygen and nitrogen) in a molecule, including the hydrogen atoms bonded to them. TPSA_diff: The difference in TPSA between product molecule SMILES and reactant molecule SMILES.
10.QED(Quantitative Estimate of Drug-likeness): QED is a method used to quantify the drug-likeness of a molecule by combining multiple molecular descriptors into a single score between 0 and 1. QED is calculated using a combination of eight molecular descriptors: Molecular weight (MW);LogP;Number of hydrogen bond donors (HBDs);Number of hydrogen bond acceptors (HBAs);Topological polar surface area (TPSA); Number of rotatable bonds (Rot_bonds);Number of aromatic rings (AROMs);Number of alerts for undesirable chemical features (ALERTS).
11.Aromatic%(aromatic ratio: the method used in the study, is a metric used in drug design to quantify the proportion of aromatic rings in a molecule. It is calculated as the ratio of aromatic bonds to the total number of bonds in the molecule.
12.PBF(Plane of Best Fit): PBF is a method used to quantify and characterize molecules in three dimensions. It evaluates the three-dimensional structure of a molecule by calculating the average distance from all heavy atoms in the molecule to the plane of best fit. This descriptor takes into account the distance between the molecule and the created plane, which usually falls in the range of less than 2 (for small molecules).
13.PMI(Principal Moment of Inertia): PMI is a set of three values that describe the distribution of mass in a molecule. These values are derived from the moment of inertia tensor, which is a 3x3 matrix that describes how the mass of the molecule is distributed relative to its center of mass. The principal moments of inertia are the eigenvalues of this tensor and are used to describe the shape and size of the molecule in three-dimensional space. PMI Graph Description:It displays the NPR1 (Normalized PMI Ratio1) and NPR2 (Normalized PMI Ratio2) represent the first and second principal moments of inertia after normalization, respectively. In the inverted triangle diagram▼, points near the upper left indicate rod-like shapes, those near the lower right suggest planar shapes, and those near the upper right suggest spherical shapes.
If you have any questions, just fill in the contact form, and we will answer you shortly.